Update Date: April - 2024
Carlos Alegria, Yuri Nunes
Go to paper pre-print (Research Gate) Paper Link
Navigation to related reports:
US - Death Trends from Neoplasms, Ages 15-44
Country: US
Period: Yearly data from 2010 to 2022.
Cause of Death Data
The data used in this analysis is comprised of the number of deaths recorded in the USA between 2010 and 2022, categorized by underlying cause code (ICD-10), sex, and 10-year age groups. These data were acquired through the CDC WONDER system, provided by the National Center for Health Statistics of the Centers for Disease Control and Prevention (CDC). The mortality data is considered final up to 2021 but provisional from 2022 onwards. Additionally, to compare trends in multiple cause (MC) of death from neoplasms with those in underlying cause (UC) of death, we retrieved data from both the multiple cause of death databases and underlying cause of death databases.
Link to the underlying cause of death databases:
CDC Wonder Underlying Cause of Death Data
Query parameters:
For underlying cause of death data, select variable grouped by:
1. Ten-year-age-groups, 2. Gender, 3. Year, 4. UCD – ICD Chapter
Link to the multiple cause of death databases:
CDC Wonder Multiple Cause of Death Data
Query parameters:
For multiple cause of death data, select variable grouped by:
1. Ten-year-age-groups, 2. Gender, 3. Year, 4. MCD – ICD Chapter
Limitations on CDC Data Utilization:
In this research paper we abide by the CDC’s restrictions on data use which are:
In alignment to the guidelines set forth by the Centers for Disease Control and Prevention (CDC) regarding data utilization, this research paper complies with the following restrictions:
“The Public Health Service Act (42 U.S.C. 242m(d)) provides that the data collected by the National Center for Health Statistics (NCHS) may be used only for the purpose for which they were obtained; any effort to determine the identity of any reported cases, or to use the information for any purpose other than for health statistical reporting and analysis, is against the law. Therefore, users will:
We investigate trends in death rates from neoplasms (ICD-10 codes C00-D48) for all age groups in the US using data from the CDC (Centers for Disease Control and Prevention). We also perform a detailed analysis for older individual aged 75 to 84. We investigate trends in neoplasms where these appear on multiple causes (MC) of death, or as the underlying cause (UC), as well as the trends in the ratio of multiple cause to underlying cause death rates.
For individuals aged 75 to 84 we show a rise in excess mortality from neoplasms reported as the underlying cause of death, which started in 2021 (+4.8%) and increased substantially in 2022 (+11.5%). The increase in excess mortality in both 2021 (Z-score of 10.5) and 2022 (Z-score of 25.1) are highly statistically significant (extreme events). When looking at neoplasm deaths reported as multiple cause of death, we observe a similar trend, but starting in 2020, with excess mortality of +3.4% in 2020, +9.2% in 2021, and +16.4% in 2022, which were also highly statistically significant.
The larger rise of excess death rates due to neoplasms in multiple causes compared to underlying cause indicates that some deaths from neoplasms are being brought forward by other causes. However, the rise in cancers as underlying cause indicates that there might also be an unexpected rise in the incidence of fatal cancers, an increase in rapid growth cancers and/or an acceleration of existing cancer cases leading to earlier death.
We also show that excess deaths from cancers occurred for most age groups, with the strongest effect in ages 15-24 and individuals 65 and older. The results indicate that from 2020 a novel phenomenon leading to increased neoplasm deaths appears to be present. An exception was observed for individuals aged 55-64. This cohort did not exhibit excess deaths from neoplasms in 2020, 2021 or 2022.
In this section we analyse the trend in yearly death rates for individuals aged 75 to 84 in the USA. In this analysis we use the 2010-2019 trend in deaths per 100,000 (death rates) as the baseline estimate for excess death rates. Excess death rates for the 2010-2019 period are in-sample while the rates for 2020, 2021, and 2022 are out of sample computations.
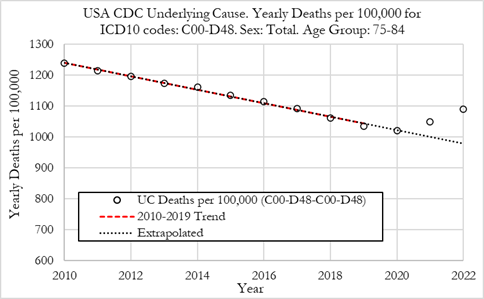
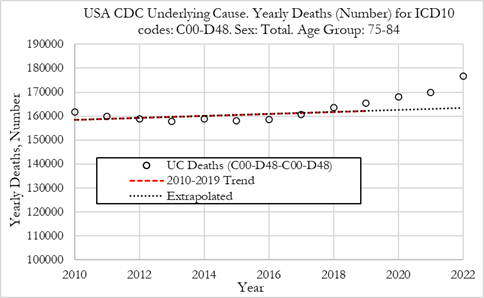
The Figure (left) below shows the death rate per 100,000 individuals for neoplasm deaths (ICD-10 codes C00 to D48) as underlying cause in the US, for the 75-84 age group of both sexes. The Figure on the right shows the absolute number of deaths.
Summary:
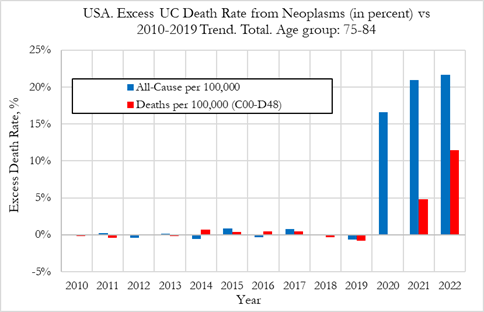
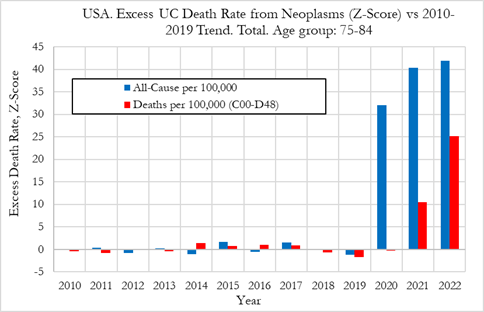
In this section we investigate the trends in excess death rates from neoplasms as underlying cause in the US, for the 75 to 84 age group from 2010 to 2022. We also show the excess all-cause deaths for comparison. The figure on the left refers to relative deviations from the 2010-2019 trend, while the figure on the right shows the Z-score (signal strength) for the deviations from trend.
In the figure (left) we can observe that the excess death rates from neoplasms as the underlying cause were slightly negative in 2020 at -0.1%, then rose to +4.8% in 2021, and +11.5% in 2022. By comparison, the excess mortality for all-cause deaths was +16.6% in 2020, +20.9% in 2021, and +21.7% in 2022. Noteworthy is that while excess mortality for all-cause deaths increased only slightly from 2021 to 2022, excess deaths from neoplasms as the underlying cause rose substantially.
When translating these values into absolute number of excess deaths, the UC excess death rates from neoplasms correspond to -208 excess deaths in 2020, 7815 in 2021 and 18213 in 2022. For comparison, for all-cause death rates, the corresponding number of excess deaths were 117235 in 2020, 143592 in 2021 and 147040 in 2022.
In terms of statistical significance of the excess deaths, we observe from Figure 4 (right) that the Z-scores for neoplasm death rate deviations from trend were 10.5 in 2021 and 25.1 in 2022. The strength of the excess deaths from neoplasms was of similar magnitude when we analysed younger individuals aged 15-44.
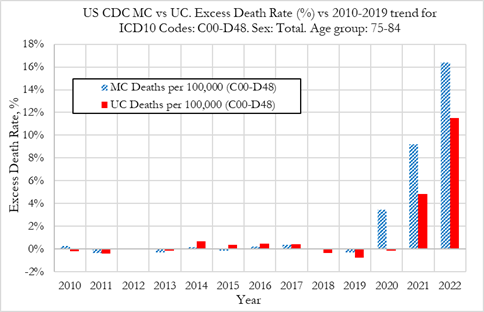
In the figure (left) we can observe that the excess MC death rates from neoplasms were +3.4% in 2020, then rose to +9.2% in 2021, and +16.4% in 2022. By comparison, the excess UC death rates were -0.1% in 2020, +4.8% in 2021, and +11.5% in 2022. Of note is that the rise in excess mortality for MC deaths from cancer were greater than for UC deaths, particularly in 2020.
In terms of absolute numbers, the MC excess death rates from neoplasms correspond to 6488 excess deaths in 2020, 16806 in 2021 and 29231 in 2022. For UC excess death rates, the corresponding number of deaths were -208 in 2020, 7815 in 2021 and 18213 in 2022.
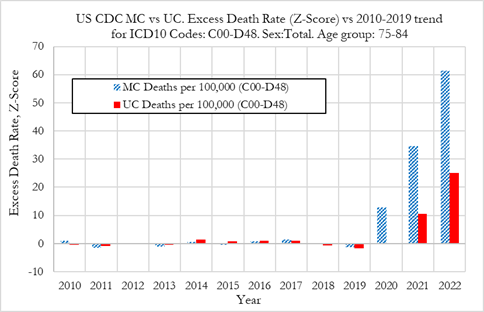
In terms of the statistical significance of the excess deaths, when looking at excess MC deaths from neoplasms, the Z-score in 2020 was 12.9, indicating that the increase in neoplasm-related deaths is a very strong signal. That trend however accelerated substantially in 2021 and 2022 where we observe Z-scores of 34.6 and 61.4, respectively. These are extreme events, akin to those observed for UC cancer deaths.
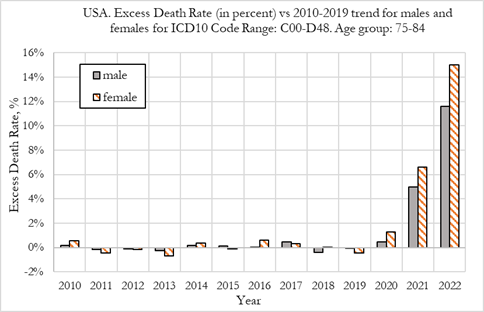
We now compare excess deaths rates from neoplasms for males and females aged 75-84, as shown in the Figure below.
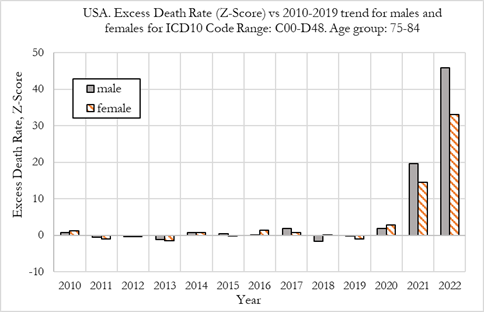
When comparing excess UC death rates from neoplasms for males and females, shown in the figure below, we observe that in 2020, while females had +1.27% excess mortality, males experienced only +0.45% excess mortality, with Z-scores of 2.8 and 1.8 respectively. The results indicate that the excess neoplasm mortality for females might point to a small signal, with weak statistical significance, in 2020.
In 2021 excess UC death rates from neoplasms for males was about +5.0% while +6.6% for females, both having Z-scores above 10, indicating very high statistical significance. For individuals aged 75-84 in the US, females experienced higher excess deaths rates from neoplasms compared to males in 2021. This is the opposite of our findings for ages 15 to 44 where males experienced almost double the excess deaths from neoplasms compared to females in 2021.
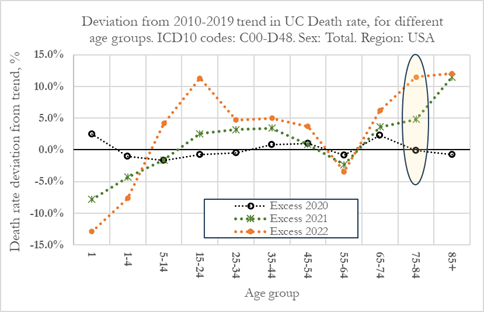
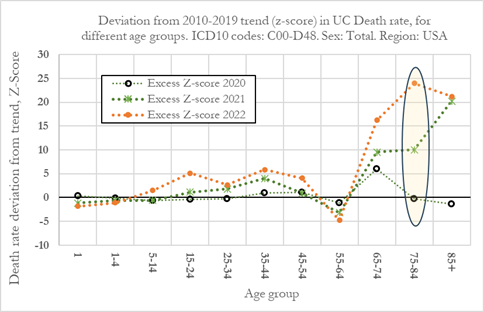
In this section we investigate the excess death rates from neoplasms as underlying cause in the US, for all age groups (10-year groups) for 2020, 2021 and 2022. The figure on the left refers to relative deviations from the 2010-2019 trend, while the figure on the right shows the Z-score (signal strength) for the deviations from trend.
The figure below shows that the excess UC death rates from neoplasms seem to have started in 2021 and risen substantially in 2022 for ages 15 and above. One exception however is the 55-64 age group where excess death rates from neoplasms actually decreased over the same period. Individuals aged 5-14 also seem to have experienced excess death rates from neoplasms, but only in 2022, with low signal strength due to the small sample size. For age groups 1 and 1-4, we observe large negative excess deaths due to neoplasms albeit without statistical significance which we attribute to small sample sizes for these age groups.
In 2022, within younger individuals (aged 5-54), excess death rates were highest for age group 15-24. Excess death rates were negative for age group 55-64 which is an exception from the overall pattern of increasing excess deaths from cancers. This observation should be subject for further detailed investigation, to better understand the underlying phenomenon. Older individuals aged 75 and older show the highest rises in UC excess deaths from cancers in 2021 and 2022 with individuals 85 and older being the most affected. Signal strengths for the younger age-groups vis-à-vis older age groups is due to larger sample sizes for older individuals.
Summary:
